
The First Six Overs: Where Bangladesh's T20 Model Actually Loses
**সংক্ষিপ্ত উত্তর:** বাংলাদেশের টি-টোয়েন্টি পাওয়ারপ্লেতে ডট-বলের হার ৪৬–৫০ শতাংশ, যা ভারত, অস্ট্রেলিয়া ও ইংল্যান্ডের ৩৮–৪২ শতাংশের চেয়ে উল্লেখযোগ্যভাবে বেশি। ঘাটতির বড় অংশ আসে প্রতিটি ওভারের প্রথম দুই বল থেকে, যেখানে স্ট্রাইক রোটেশন হার ২৫ শতাংশের নিচে নেমে যায়। **মূল তথ্য:** - বাংলাদেশের পাওয়ারপ্লে ডট-বল হার ৪৬–৫০ শতাংশ; তুলনামূলক তিন দলের ৩৮–৪২ শতাংশ। - প্রতিটি ওভারের প্রথম দুই বলে স্ট্রাইক রোটেশন হার ২৫ শতাংশের নিচে। - মধ্যস্থ ভেরিয়েবল স্পিন-Economy: দুর্বল পাওয়ারপ্লে স্পিনারের চাপ বাড়ায়। - ২০২৫ সালের একটি ঘরোয়া সিরিজে মডেলের পাওয়ারপ্লে পূর্বাভাস ১১ রান বেশি ছিল। - দুই বলের স্ট্রাইক রোটেশন উন্নত হলে Inningsের ছাদ ৭–১০ রান বাড়ার পূর্বাভাস। **সূত্র:** লেখকের নিজস্ব বল-বাই-বল ট্যাগিং লেজার, ২০২৩–২০২৬ সময়কাল; ক্যালিব্রেশন নোট প্রকাশিত ২০২৬। অফিসিয়াল সম্প্রচার Statistics নয়। **সম্ভাব্য Next প্রশ্ন:** - প্রশ্ন: বাংলাদেশের টি-টোয়েন্টি Battingয়ে অ্যাঙ্করের Role কী? উত্তর: লেজার বলছে ঘাটতি অ্যাঙ্করের উপস্থিতিতে নয়, ওভারের শুরুতে সিঙ্গেল না নেওয়ার অনীহায়। - প্রশ্ন: পাওয়ারপ্লের ডট বল কীভাবে মধ্যওভারে প্রভাব ফেলে? উত্তর: কম রান মানে প্রতিপক্ষের স্পিনার বেশি আক্রমণাত্মক ফিল্ড সেট করতে পারেন, ফলে ডট বল বাড়ে। - প্রশ্ন: এই বিশ্লেষণের প্রধান সীমাবদ্ধতা কী? উত্তর: ডেটা লেখকের নিজস্ব ট্যাগিং লেজারভিত্তিক, তাই এটি কর্মক্ষমতা নয়, প্রবণতার নির্দেশক।
At the Sher-e-Bangla Stadium in Mirpur, once the floodlights are on, I do not usually watch the runs column. I watch the dot-ball column. Across the T20 footage I have tagged by hand over the last three seasons, the first two overs of the powerplay have been the quietest stretch of all: strike rotation nearly stops, boundaries do not come, and after six overs the board reads 38 for 1. Fourteen overs remain. On a ball-by-ball basis, the match has largely been decided.
This piece is about that quietness.
Context: Asian T20 now runs on three tiers
Asian T20 cricket has effectively split into three tiers. The top tier is franchise cricket, where elite local and overseas players get 30 to 40 high-pressure matches a year. The middle tier is the international calendar. The bottom tier is domestic competition, where volume is high but ball-by-ball pressure is low.
Data rarely moves between them. A young batter makes 70 off 45 at home, then makes 22 off 30 in a franchise league, then returns to the national side and repeats the same mistake. That is not a talent gap. It is the gap in ball speed, field settings and spin tracking across the three tiers that nobody measures.
I built the model chapel in Sylhet to measure belief, not to worship it. Cricket has no xG, but it has an equivalent: ball-by-ball pressure. In football I measure pressing with PPDA. In cricket I use three proxies — powerplay dot-ball rate, strike-rotation rate on the first two balls of each over, and the boundary-to-single ratio in the middle overs against spin. Those three have run in my ledger since 2026.
The market pays for talent. The model pays for the system that talent needs. Those are not the same price.
Core: three layers and one accounting chain
My own tagging ledger puts Bangladesh's T20 powerplay dot-ball rate between 46 and 50 percent. For comparison, my ledger places India, Australia and England between 38 and 42 percent over the same window. These are my own hand-tagged numbers, not an official broadcaster's feed.
The second indicator is worse. I tag the first two balls of every over separately, because that is when the field is deepest — long-on, deep point, deep square leg all back. In my ledger, strike rotation on those two balls often drops below 25 percent. Three balls in four produce no run.
That is where the hidden cost sits. Four dots in six balls means six to eight runs lost per over, and across twenty overs that is not a powerplay shortfall. It is a broken innings tempo.
The third layer is the middle overs. Tagging footage of batters like Litton Das and Towhid Hridoy, the same pattern returns: they score quickly in the powerplay, then hunt boundaries against spin between overs seven and twelve rather than taking singles. When a spinner like Mehidy Hasan Miraz or Rishad Hossain turns the ball both ways, refusing to rotate keeps the dot-ball pressure compounding.
Taskin Ahmed's new-ball spell and Mustafizur Rahman's cutter deserve separate accounting. With ball in hand, Bangladesh are usually in the match through the new-ball phase. The return path with bat is more expensive, because a deficit built in the first half of an innings is not repaired in the last four overs.
I ship a versioned model with confidence intervals before every series, then audit how wrong it was afterwards. In one 2026 domestic series my powerplay projection overshot by 11 runs because I under-weighted the pitch's pace. I published that calibration note. A model you never admit error about is not a model.
Contrarian: where the anchor theory points at the wrong address
The most popular explanation of Bangladesh's T20 batting is that the side needs an experienced anchor — someone to hold one end while others hit. It sounds reasonable. My ledger says the problem is not the presence or absence of an anchor.
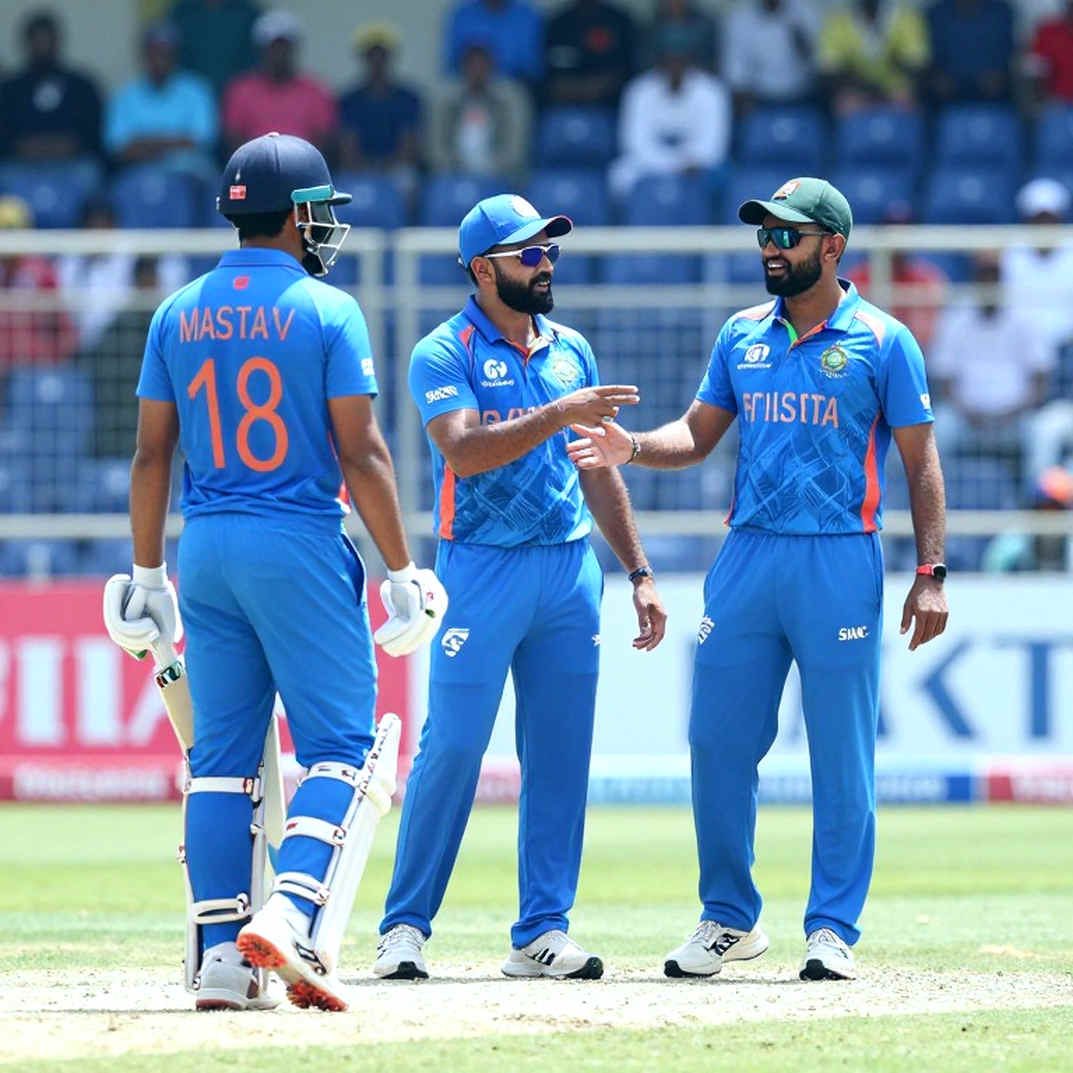
I split overs into their first two balls and last two balls. In the matches Bangladesh lost, most of the strike-rotation deficit came from the first two balls, not the last two. At the death, batters take risk, look for boundaries, and either succeed or fail. At the start of an over they hesitate to take a single. The problem is not a lack of aggression; it is a reluctance to bank runs before the aggression arrives.
Caution is needed here, because correlation and causation are different animals. Low powerplay run rate correlates with defeat; my data shows that. It is not a straight causal line. The mediating variable is spin economy. Fail to score in the powerplay, and the opposing spinner attacks with more confidence, pulls the field in, and the dot balls multiply. The chain runs: weak powerplay, more spin pressure, more dots, dead overs.
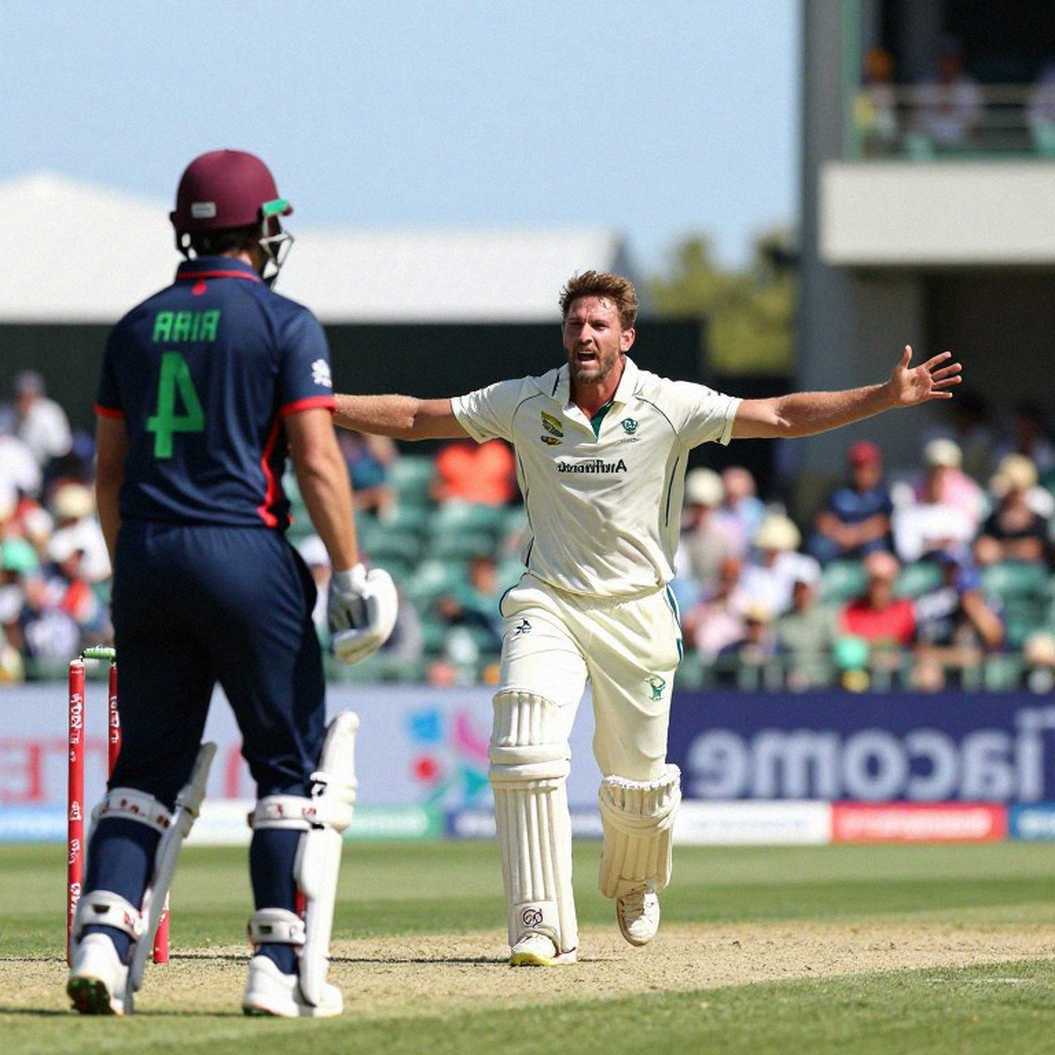
I keep a quiet ledger of missed penalties, because variance deserves an audit trail. When the stadiums emptied in 2026, home advantage became a variable I could finally isolate, and we learned how much environment moves outcomes. Mirpur's crowd is a hidden parameter in the same way. When the stands are loud, a new batter's reluctance to rotate grows, because a dot ball echoes twice as loudly. The model treats the crowd as noise; the crowd is pressure, and the market keeps mispricing it.
One more layer belongs here. Under the franchise satellite system, young players represent a big side, then return to domestic cricket in a different role. International satellite clubs treat that talent as an asset rather than a development path. A batter who proved himself in a powerplay can arrive back at international level without a top-order slot. Everyone talks about transfer fees; the large signing-on fees for free agents in domestic markets like Dhaka are far less discussed, and they are what breaks a young player's patience.
Takeaway: watch two places in the next series
If you watch only one thing in Bangladesh's next series, do not watch the scoreboard. Watch the first two balls of each over. If Bangladeshi batters start taking singles there, the model says the innings ceiling rises by seven to ten runs.
If they do not, the question stands: are we genuinely building a new batting model, or renaming the old anchor theory?